The RMS Database Server
RMS Summary Page: G323.4584-00.0787
| SIMBAD search | HEASARC search (search all VizieR Cat.) |
| SIMBAD search | HEASARC search (search all VizieR Cat.) |
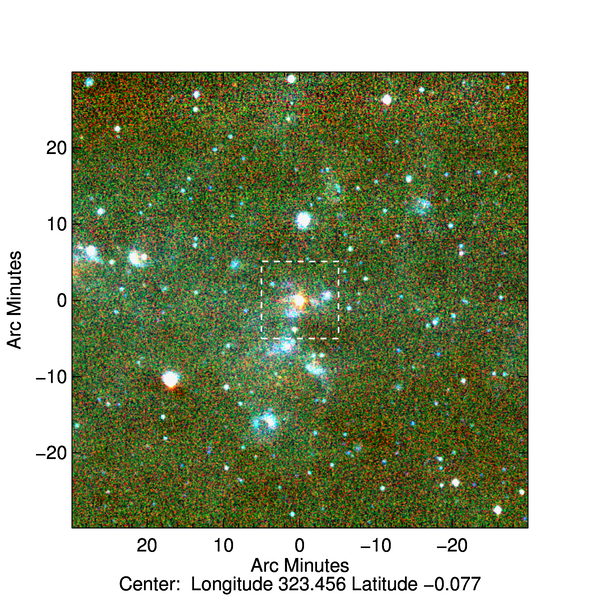 Three Colour MSX Image (1° x 1°) (download postscript) |
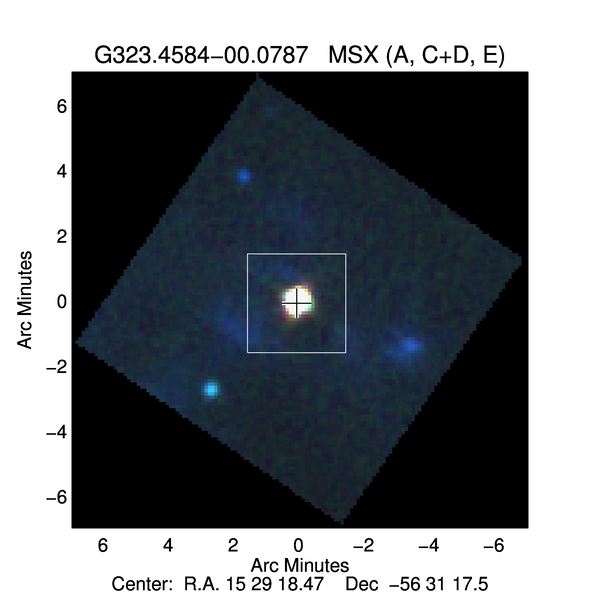 Three Colour MSX Image (15´ x 15´) (download postscript) |
These images have been obtained from the MSX image archive located at NASA/IPAC Infrared Science Archive. The 8 μm band is dominated by emission from polycyclic aromatic hydrocarbons (PAHs) is coloured blue, the 12 and 14 μm bands have been coadded and coloured green, the 21 μm band reveals emission from warm dust and is coloured red. The region outlined in white in the image on the right shows the region presented in the 2MASS images below. The position of the RMS sources is indicated by a cross and we have drawn a circle around nearby RMS sources in the field.
| RMS Id. | MSX Name | Source Type | RA | Dec | Astrometry a | 8 μm | 12 μm | 14 μm | 21 μm | VLSRb | Distance c | Z Height c | Lum.d | Bol. Lum.e |
|---|---|---|---|---|---|---|---|---|---|---|---|---|---|---|
| (J2000) | (J2000) | (Jy) | (Jy) | (Jy) | (Jy) | (km s-1) | (kpc) | (pc) | Ratio | (Lo) | ||||
| 1298 | G323.4584-00.0787 | HII/YSO | 15:29:19.36 | -56:31:21.7 | radio | 33.56 | 102.78 | 153.92 | 364.02 | -67.53 | 4.21 | -5.8 | 1 | 1.3e+051 |
| IRAS | RA | Dec | Offset | 12 μm | 25 μm | 60 μm | 100 μm |
|---|---|---|---|---|---|---|---|
| Name | (J2000) | (J2000) | ('') | (Jy) | (Jy) | (Jy) | (Jy) |
| IRAS 15254-5621 | 15:29:19.6 | -56:31:23 | 3 | 84.10 | 522.00 | 3010.00 | 4100.00 |
|
|
||||
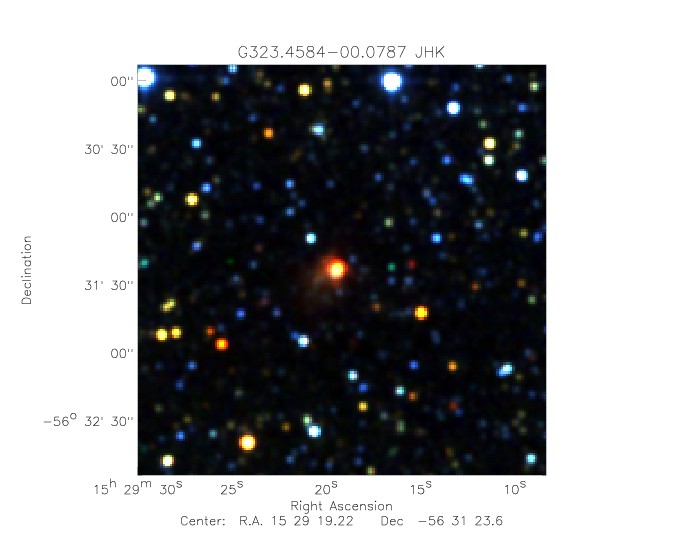
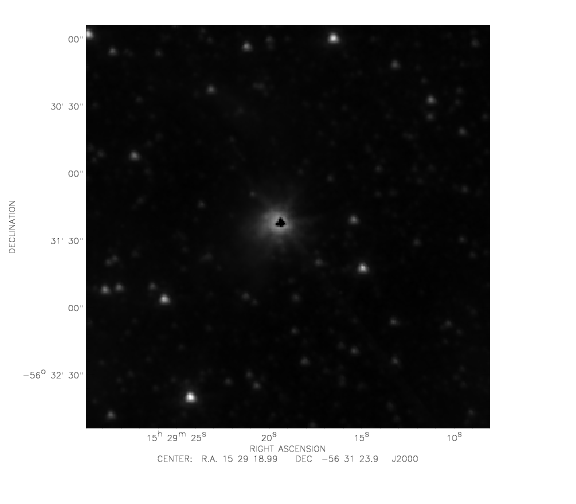
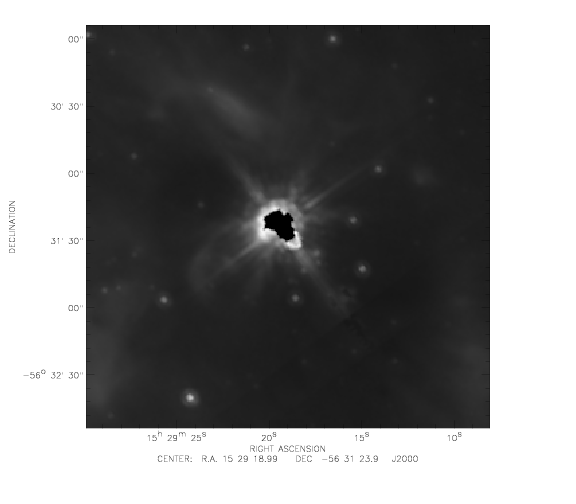
| Label | Source name | Offset ('') | RA (J2000) | Dec (J2000) | J Mag | H Mag | K Mag | Quality flag |
|---|---|---|---|---|---|---|---|---|
| a* | 15291948-5631235 | 2.0 | 15:29:19.49 | -56:31:23.5 | 14.2 | 11.6 | 8.4 | AEU |
| d | 15292014-5631212 | 6.5 | 15:29:20.15 | -56:31:21.3 | 15.0 | 12.5 | 11.6 | UUE |
| b | 15291864-5631188 | 6.6 | 15:29:18.64 | -56:31:18.8 | 15.1 | 14.3 | 13.5 | ABD |
| c | 15291948-5631297 | 8.0 | 15:29:19.49 | -56:31:29.7 | 14.8 | 12.8 | 12.3 | UUE |
| h | 15292035-5631266 | 9.6 | 15:29:20.36 | -56:31:26.7 | 14.9 | 12.8 | 12.0 | UUE |
| f | 15291810-5631232 | 10.5 | 15:29:18.11 | -56:31:23.3 | 15.9 | 14.3 | 12.9 | BUU |
| e | 15291823-5631277 | 11.1 | 15:29:18.24 | -56:31:27.8 | 16.4 | 14.6 | 13.0 | CUU |
| g | 15291934-5631334 | 11.6 | 15:29:19.35 | -56:31:33.4 | 15.5 | 14.6 | 12.0 | ABU |
| i | 15291797-5631234 | 11.6 | 15:29:17.97 | -56:31:23.4 | 15.6 | 14.3 | 13.9 | UUC |
| k | 15292089-5631095 | 17.7 | 15:29:20.90 | -56:31:09.5 | 13.0 | 11.9 | 11.6 | AAA |
| Date | Telescope | Instrument | Band | Spectral res. | Reduced |
|---|---|---|---|---|---|
| 060608 | AAT | IRIS-2 | H+K | 1200 | No |
|
|
||||
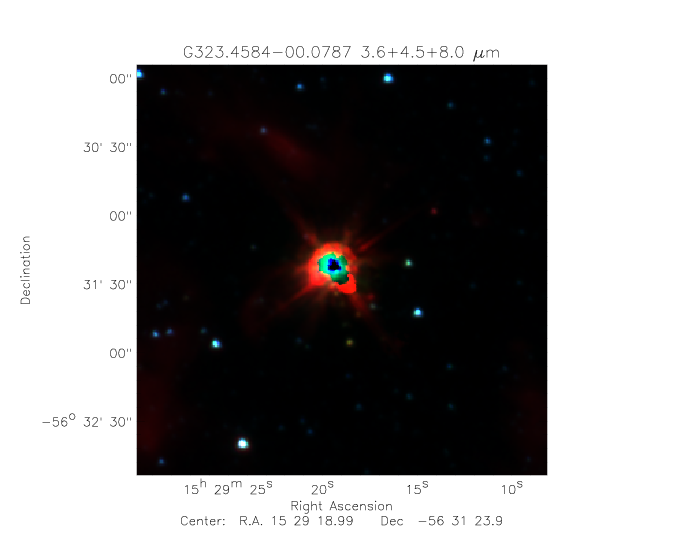
View combined GLIMPSE and MIPSGAL images using the Space Science Institute GLIMPSE/MIPSGAL VIEWER
 Cropped image |
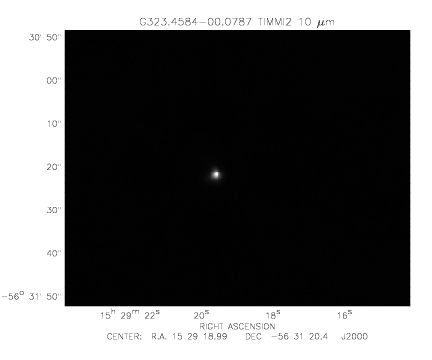
| Cat. Id. | Source Id. | RA (J2000) | Dec (J2000) | Offset ('') | Flux (Jy) | Source size (Maj x Min) | Classification | Reference |
|---|---|---|---|---|---|---|---|---|
| 324 | 1 | 15:29:19.59 | -56:31:21.9 | 1.9 | 29.00 | 1.6 x 1.5 | Point source | Mottram et al. 2007 |
* Telescope pointing position assummed to be the same as MSX position.
| RMS-WISE | RA | Dec | Offset | 3.4 μm | 4.6 μm | 12 μm | 22 μm |
|---|---|---|---|---|---|---|---|
| Id. | (J2000) | (J2000) | ('') | (Jy) | (Jy) | (Jy) | (Jy) |
| 1561 | 15:29:19.33 | -56:31:21.7 | 0.24 | 1.8 | 0.7 | 85.2 | 616.3 |
| 1560 | 15:29:21.48 | -56:31:28.7 | 18.92 | 0.0 | 0.0 | 0.5 | 20.5 |
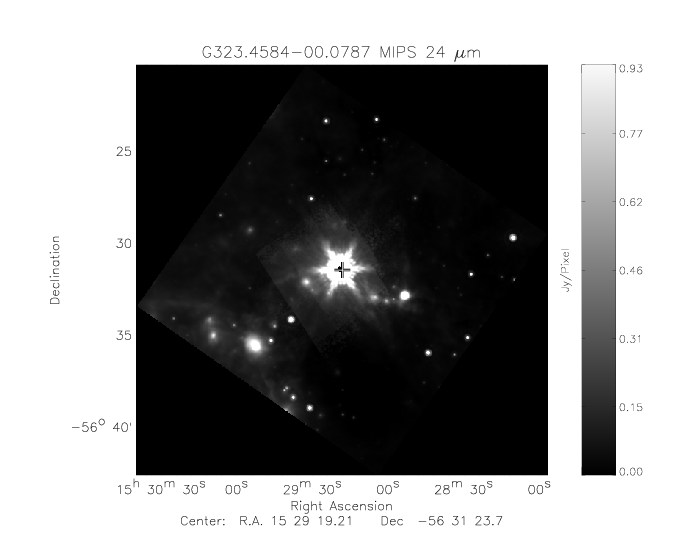 24 μm (MIPS) |
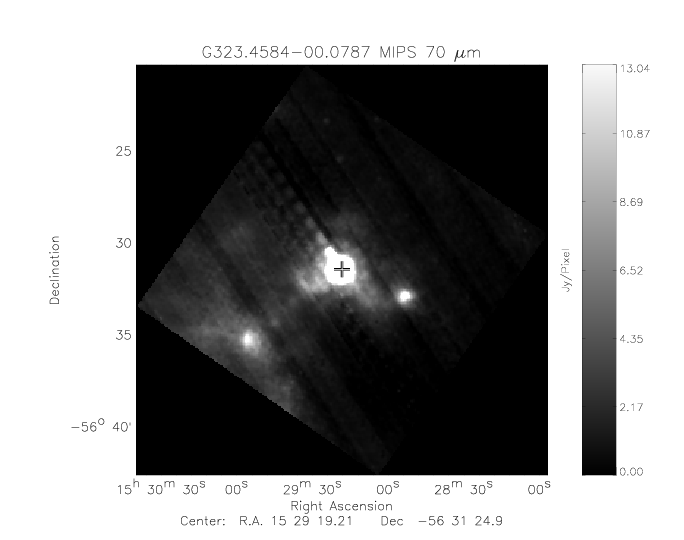 70 μm (MIPS) |
| IGA 60 Flux (Jy) | IGA 100 Flux (Jy) | MIPS 70 Flux (Jy) | IRAS 60 Flux (Jy) | IRAS 100 Flux (Jy) | IRAS Offset ('') | Reference | 3560.21 (0.1%) | 4867.79 (0.2%) | NA (%) | 3010 (8%) | 4100 (10%) | 3 | Mottram et al., 2010 |
|---|
Fluxes measured from IRAS Galaxy Atlas (IGA; Cao et al., 1997) and MIPSGAL 70 Micron (Carey et al., 2009) images using background-fitting photometry. The MIPSGAL fluxes have been corrected for pixel non-linearity. The errors in the IGA and MIPSGAL fluxes do not include systematic errors, which are ~25% for the IGA and ~15% for MIPSGAL 70 micron.
| Cat. ID | Name | RA (J2000) | Dec (J2000) | Offset ('') | Source size ('') | 1.2mm Peak flux (Jy) | 1.2mm Integrated flux (Jy) | Telescope | Reference |
|---|---|---|---|---|---|---|---|---|---|
| 189 | G323.4597-00.0816 | 15:29:20.33 | -56:31:29.3 | 11.0 | 34.0 | 11.6 | SIMBA | Faundez et al. 2004 |
 |
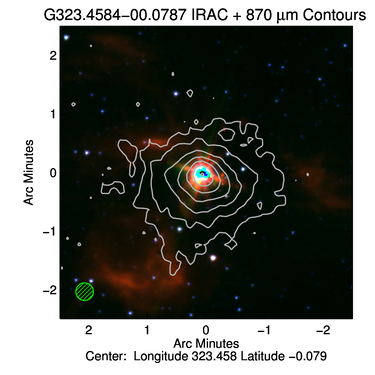 |
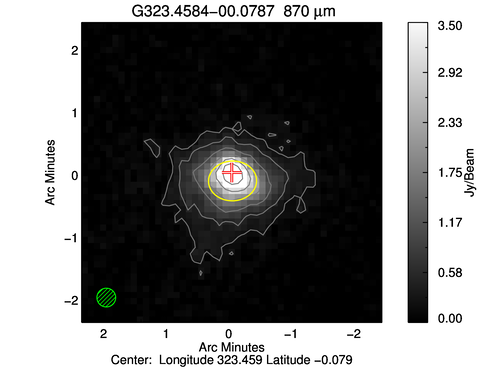
The image presented in the left panel is a 5x5 arcmin region extracted from the ATLASGAL tiles and is centred on the position of the peak flux associated with the source. The source size and orientation is shown by the blue ellipse, while the sizes and orientations of any other detected sources located in the field are shown in yellow. The contours shown in grey start at 3 sigma and increase in steps determined by a dynamic power law (see Thompson et al. 2006 for details). The angular resolution of the ATLASGAL survey is indicated by the hatched red circle shown in the lower left corner. In the right panel we present a three colour mid-infrared image created using the 4.5, 5.8 and 8 μm IRAC band filters extracted from the GLIMPSE Legacy Project. Contours show the distribution of the dust with respect to the infrared emission (contour levels are the same as shown in the left panel). The white hatched circle shown in the lower left corner of this image again indicates the resolution of the ATLASGAL survey.
| Source Name | RA | Dec | Offset | Size | PA | Eff. Radiusa | Peak Flux | Integrated Flux | Detectionb | Reference |
|---|---|---|---|---|---|---|---|---|---|---|
| (J2000) | (J2000) | ('') | ('') | (o) | ('') | (Jy beam-1) | (Jy) | Flag | ||
| AGAL323.459-00.079 | 15:29:19.48 | -56:31:23.2 | 1.8 | 23 x 19 | 92 | 46 | 6.01 | 29.17 | 0 | Urquhart et al. 2014 |
 |
| Line transition | ||||||||||
|---|---|---|---|---|---|---|---|---|---|---|
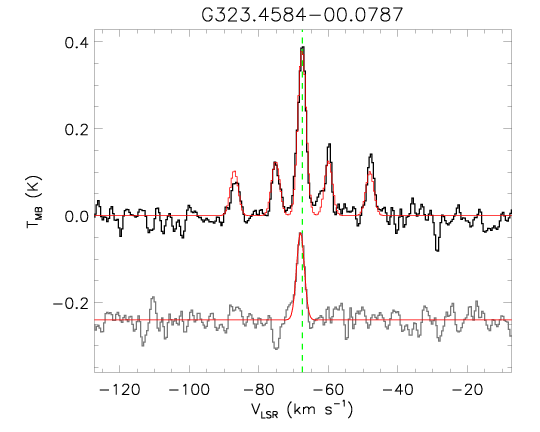
| NH3 (1,1) | NH3 (2,2) | Cat. Id. | rms (mK) | VLSR (km/s) | T_MB (K) | FWHM (km/s) | Optical Depth | rms (mK) | VLSR (km/s) | T_MB (K) | FWHM (km/s) | Reference |
| 390 | 12 | -67.57 | 0.39 | 6.05 | 1.05 | 12 | -68.04 | 0.20 | 2.62 | Unpublished Data |
These ammonia results are preliminary and may change as we refine both the calibration and fitting routines and therefore should be used with caution. Users are advised to contact a member of the RMS team if you intend using any of the results available here in a publication to insure the results are reliable.
| Cat. Id. | MMB Name | RA (J2000) | Dec. (J2000) | Offset ('') | Min VLSR (km/s) | Max VLSR (km/s) | Peak VLSR (km/s) | Peak Intensity (Jy) | Reference |
|---|---|---|---|---|---|---|---|---|---|
| 151 | G323.459-00.079 | 15:29:19.33 | -56:31:22.8 | 1.04 | -68.5 | -66 | -66.9 | 17.81 | Green et al. 2012 |
| Cat. ID | Freq. (GHz) | Radio name | RA (J2000) | Dec. (J2000) | Offset ('') | Source size ('') | Peak flux (mJy) | Int. flux (mJy) | Morphology | Telescope | Reference |
|---|---|---|---|---|---|---|---|---|---|---|---|
| 4939* | 8.6 | G323.4591-00.0787 | 15:29:19.36 | -56:31:21.7 | 0.00 | 312.0 | NULL | ATCA | Walsh et al. 1998 |
The following catalogues are searched for possible radio matches: Purcell et al. 2013, Urquhart et al. (2007, 2009), White et al. (2005), Sridharan et al. 2002, Walsh et al. (1998), Kurtz et al. (1994). Not all catalogues included have a homogeneous set of data and therefore you may find a number of fields are left blank.